Immigration Restrictions
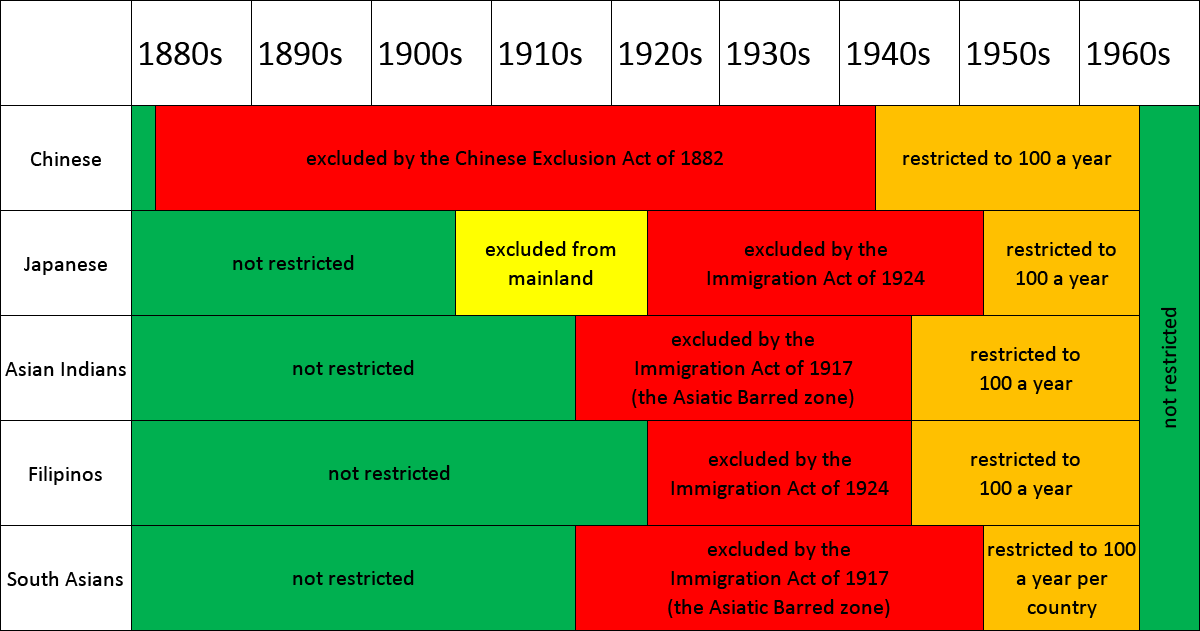
For much of the 20th century, Asians were barred from immigrating to the United States.
First, the Chinese Exclusion Act of 1882 barred Chinese immigrants, while still allowing immigration by other groups.
Second, the Gentlemen’s Agreement of 1907 restricted Japanese immigrants to Hawaii.
Third, the Immigration Act of 1917 barred immigration from the “Asiatic Barred Zone,” which covered most of South Asia.
Finally, the Immigration Act of 1924 barred all immigration from Asia, including Japan and the Philippines, which had not been previously barred.
The United States ended some restrictions in the 1940s and then lifted all official restrictions on Asian immigration in 1952, but immigration was still restricted to small quotas. Finally, in 1965, the United States ended the quotas, which opened the door for many Asian Americans and Pacific Islanders.

Without the changes in immigration law in 1965, Asian Americans would have remained a small part of the American population, about 1 percent, according to an estimate prepared by the Pew Research Center. This graph compares the actual Asian American population over time (BLUE) vs. the estimated population if the 1965 changes had not happened (RED).
In recent decades, most immigration has been through family preferences, with the main sources of immigration being (1) the immediate relatives of U.S. citizens, such as spouses, children, and parents and (2) family-sponsored preferences. Other immigrants have become legal permanent residents through employment-sponsored preferences, being admitted as refugees or being granted asylum, and a diversity lottery for underrepresented countries.
As shown in the charts below, immigration from Asia has been far greater than immigration from Europe in recent decades, and immigration from Asia has sometimes exceeded that from other parts of North America.


